

Kindie (Kubernetes Individual) is an opinionated Kubernetes cluster setup for individuals or small business. Batteries included so that you can hit the ground running and add production workload in no time.
Target audience
Sysadmin, DevOps, Cloud engineer with Linux and Kubernetes experience looking to build a Kubernetes cluster for production usage with bells and whistles focussed on web workloads. You should be able to have the cluster ready in a few hours. If you don’t understand some of the information here, please comment below or research it on the internet. This guide is not meant for complete beginners but we try to keep it as accessible as possible without going into too much details.
Features
- Highly available (where possible)
- Ingress with LetsEncrypt
- NFS central storage
- Cluster that scales
- Monitoring with Prometheus, Grafana and Loki
Disclaimer
Feel free to change the setup as you wish but you’re on your own. Eventhough we claim this is production ready for ourselves, it might not be for you. So adjust and test this setup further until you are satisfied. We deliberately use root user instead of sudo to save time. And because we know what we are doing (most of the time).
Hardware specifications
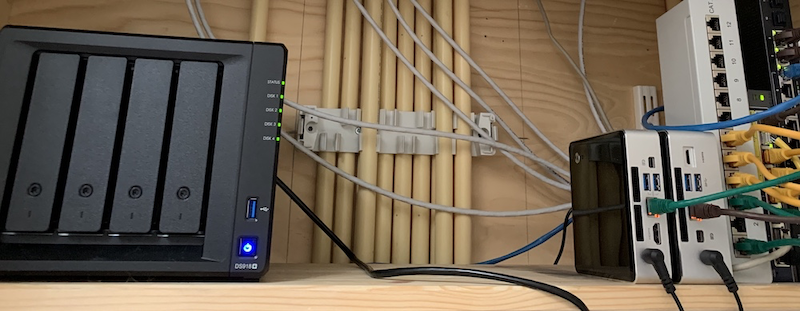
- a router with uplink
- Synology DS918+ with 16GB memory and 4TB of storage capacity
- UPS for data safety
- 2 NUC with 100 GB disk storage and 16 GB memory each
- access to manage a domain (example.dev)
- Ubuntu server 20.04 ISO downloaded and on USB stick to install the NUC’s
Architecture
To give you a birds-eye view of what you’re about to build.
Network
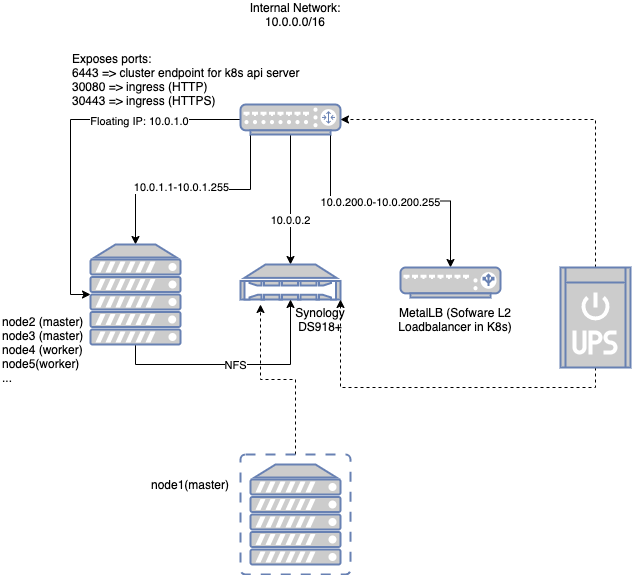
The core router serves the internal network 10.0.0.0/16. This is inline with default networks in public cloud services like AWS VPC’s. There’s plenty of room to expand your cluster and you will probably never use all the allocatable addresses here anyway. Of this range we have the following static addresses:
- 10.0.0.1 => Gateway address on the router
- 10.0.0.2 => Synology
- 10.0.1.0 => Floating IP assigned to keepalived master. This address is highly available and therefore used for cluster endpoint of Kubernetes API server and HTTP(s) ingress into the cluster
- 10.0.1.1 => node1 (this is a Virtual Machine (VM) running in Synology)
- 10.0.1.2 => node2
- 10.0.1.3 => node3
- 10.0.200.0-10.0.200.255 => range reserved for internal loadbalancers (Metal LB)
There’s also an optional UPS supporting the core of the system: router + synology. Synology also exposes the NFS so that nodes can use it as central storage.
Kubernetes
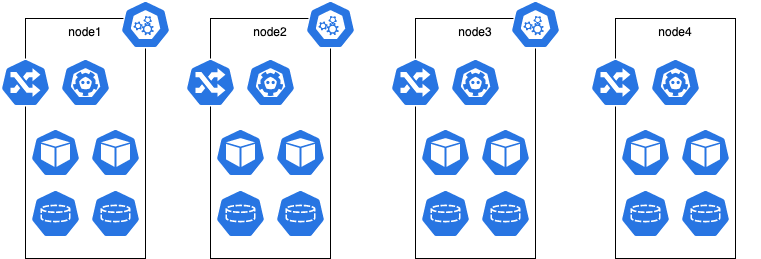
Above merely shows that there are 3 master nodes and N worker nodes where N is larger or equal to zero. Each node will run an ingress controller for HA. In this setup we untaint the master nodes so that regular workloads can be scheduled on them; therefore treat them like worker nodes.
Namespaces
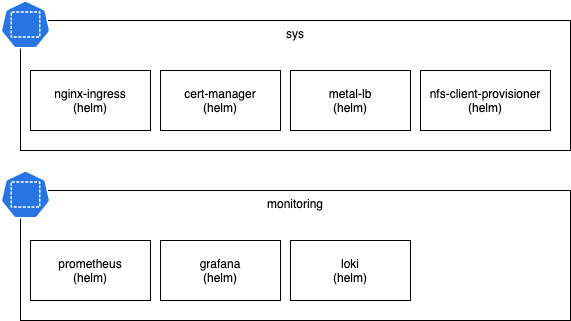
The batteries included are split up in 2 namespaces:
- sys: internal misc services needed to support apps; sort of like shared infra services
- monitoring: everything related to monitoring
Preparations
- Configure router to have as internal network:
10.0.0.0/16and create the port forward rules as described in the Network Architecture diagram. - Create a DNS record of type A:
cluster-endpoint.sys.example.dev=>10.0.1.0 - Create a wildcard DNS record of type A (or CNAME if you want):
*.app.example.dev=>YOUR_PUBLIC_IP - Create another wildcard DNS record of type A (or CNAME if you want):
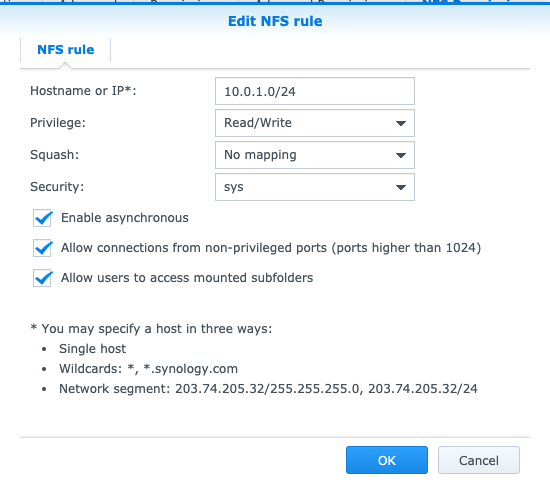
*.sys.example.dev=>YOUR_PUBLIC_IP - Setup your Synology and set the address to
10.0.0.2 - Setup Synology to allow NFS mounts from
10.0.1.0/24
- Create a VM in Synology called
node1with 7GB RAM and 100GB disk, install ubuntu-server:- set manual IP to
10.0.1.1/16 - set hostname to
node1 - install OpenSSH
- create user
ops
- set manual IP to
- install all your other physical/dedicated nodes as above (obviously use 10.0.1.2/16 for node2, 10.0.1.3/16 for node3, etc…)
Kubernetes Cluster
At this point you have 3 nodes running: node1, node2 and node3. Because the first 3 nodes are master nodes, we will prepare them all with keepalived and kubeadm. For each node login over SSH to it using the ops username and password you used during installation. After you login switch to root user with sudo su and enter your password again.
Keepalived
apt install -y keepalived
Create a file /etc/keepalived/keepalived.conf with the content:
vrrp_instance VI_1 {
    state MASTER
    interface ens3
    virtual_router_id 101
    priority 100
    advert_int 1
    authentication {
        auth_type PASS
        auth_pass RANDOM_STRING_HERE
    }
    virtual_ipaddress {
        10.0.1.0
    }
}
Replace RANDOM_STRING_HERE with a strong password of your choice if you want (since this is internal network this is not a very big deal).
It is however necessary to set the correct interface name. You can find it with ip a.
After that we can wrap up with:
systemctl enable keepalived
systemctl start keepalived
We use the same keepalived.conf for all master nodes so that the active master is randomly selected. Feel free to adjust the priority if desired to influence the preference.
Kubernetes install
We will use the official installation guide to install Kubernetes:
Container Runtime
cat > /etc/modules-load.d/containerd.conf <<EOF
overlay
br_netfilter
EOF

modprobe overlay
modprobe br_netfilter

# Setup required sysctl params, these persist across reboots.
cat > /etc/sysctl.d/99-kubernetes-cri.conf <<EOF
net.bridge.bridge-nf-call-iptables  = 1
net.ipv4.ip_forward                 = 1
net.bridge.bridge-nf-call-ip6tables = 1
EOF

sysctl --system

curl -fsSL https://download.docker.com/linux/ubuntu/gpg | apt-key add -
add-apt-repository \
    "deb [arch=amd64] https://download.docker.com/linux/ubuntu \
    $(lsb_release -cs) \
    stable"
apt-get update && apt-get install -y containerd.io
mkdir -p /etc/containerd
containerd config default > /etc/containerd/config.toml
systemctl restart containerd
Kubeadm, kubelet, kubectl
apt-get update && apt-get install -y apt-transport-https curl
curl -s https://packages.cloud.google.com/apt/doc/apt-key.gpg |  apt-key add -
cat <<EOF | sudo tee /etc/apt/sources.list.d/kubernetes.list
deb https://apt.kubernetes.io/ kubernetes-xenial main
EOF
apt-get update
apt-get install -y kubelet kubeadm kubectl
apt-mark hold kubelet kubeadm kubectl
nfs utils
Because we want to be able to mount NFS shares as PVC.
apt install -y nfs-common
node1
To install our first master node on node1, we first turn off keepalived on node2 and node3:
ssh ops@10.0.1.2 'systemctl stop keepalived'
ssh ops@10.0.1.3 'systemctl stop keepalived'
Now on node1 you can confirm it has the IP 10.0.1.0:
ip a | grep '10.0.1.0'
And confirm your DNS record is set correctly:
host cluster-endpoint.sys.example.dev
cluster-endpoint.sys.example.dev has address 10.0.1.0
After that we are ready to continue:
kubeadm init --apiserver-advertise-address=$(hostname -I | cut -d " " -f1) --control-plane-endpoint=cluster-endpoint.sys.example.dev --upload-certs
Replace the endpoint address.
After a while you will be greeted with a message similar to:
Your Kubernetes control-plane has initialized successfully!

To start using your cluster, you need to run the following as a regular user:

  mkdir -p $HOME/.kube
  sudo cp -i /etc/kubernetes/admin.conf $HOME/.kube/config
  sudo chown $(id -u):$(id -g) $HOME/.kube/config

You should now deploy a pod network to the cluster.
Run "kubectl apply -f [podnetwork].yaml" with one of the options listed at:
  https://kubernetes.io/docs/concepts/cluster-administration/addons/

You can now join any number of the control-plane node running the following command on each as root:

  kubeadm join cluster-endpoint.sys.example.dev:6443 --token XXXX.XXXX \
    --discovery-token-ca-cert-hash sha256:XXXX \
    --control-plane --certificate-key XXXX

Please note that the certificate-key gives access to cluster sensitive data, keep it secret!
As a safeguard, uploaded-certs will be deleted in two hours; If necessary, you can use
"kubeadm init phase upload-certs --upload-certs" to reload certs afterward.

Then you can join any number of worker nodes by running the following on each as root:

kubeadm join cluster-endpoint.sys.example.dev:6443 --token XXXX.XXXX \
    --discovery-token-ca-cert-hash sha256:XXXX
node2 and node3
To install node2 and node3, login to the node as ops and switch to root then execute:
  kubeadm join cluster-endpoint.sys.example.dev:6443 --token XXXX.XXXX \
    --discovery-token-ca-cert-hash sha256:XXXX \
    --control-plane --certificate-key XXXX
(Obviously, replace the values)
Join workers later
On a master node:
kubeadm token create --print-join-command
Then copy the join command and execute on new worker node
Join masters later
On a master node:
kubeadm init phase upload-certs --upload-certs
# copy certificate key
kubeadm token create --print-join-command --certificate-key $certificate_key
Then copy the join command and execute on new master node
Confirm nodes
On node1 as root execute:
export KUBECONFIG=/etc/kubernetes/admin.conf
kubectl get nodes
It should output something similar to:
NAME    STATUS   ROLES    AGE     VERSION
node1   Ready    master   3d2h    v1.18.3
node2   Ready    master   3d2h    v1.18.3
node3   Ready    master   5h46m   v1.18.3
Let’s untaint the master nodes:
kubectl taint nodes --all node-role.kubernetes.io/master-
CNI (network)
If you do kubectl get pods -A you will see coredns is not starting up correctly:
root@node1:/home/ops# kubectl get pods -A
NAMESPACE     NAME                            READY   STATUS    RESTARTS   AGE
kube-system   coredns-66bff467f8-2bqht        0/1     Pending   0          7m15s
kube-system   coredns-66bff467f8-l7pbt        0/1     Pending   0          7m15s
....
To fix that we need to install a CNI plugin, we choose Calico:
kubectl apply -f https://docs.projectcalico.org/v3.14/manifests/calico.yaml
After a while coredns is running:
root@node1:/home/ops# kubectl get pods -A
NAMESPACE     NAME                                       READY   STATUS    RESTARTS   AGE
kube-system   calico-kube-controllers-789f6df884-b8tsg   1/1     Running   0          4m58s
kube-system   calico-node-9fgqj                          1/1     Running   0          4m59s
kube-system   coredns-66bff467f8-2bqht                   1/1     Running   0          13m
kube-system   coredns-66bff467f8-l7pbt                   1/1     Running   0          13m
Smoke test
To smoke test we can run a job:
root@node1:/home/ops# kubectl run --rm=true -i --tty busybox --image=busybox --restart=Never -- ps
If you don't see a command prompt, try pressing enter.
Error attaching, falling back to logs: unable to upgrade connection: container busybox not found in pod busybox_default
PID   USER     TIME  COMMAND
    1 root      0:00 ps
pod "busybox" deleted
If you do not get output of ps something is broken.
Highly available test
So now we have 3 master nodes running in our cluster. We can test the high availability of the API server. To do that first we need to bring up keepalived on node2 and node3:
ssh ops@10.0.1.2 'systemctl start keepalived'
ssh ops@10.0.1.3 'systemctl start keepalived'
You will notice that node1 currently owns the master IP. Let’s copy the kubeconfig from the node1 to your local machine:
ssh ops@10.0.1.1 'sudo cat /etc/kubernetes/admin.conf' >> ~/.kube/config
Now you should be able to execute kubectl commands from your local machine. Do for instance:
kubectl get nodes
NAME    STATUS   ROLES    AGE     VERSION
node1   Ready    master   3d2h    v1.18.3
node2   Ready    master   3d2h    v1.18.3
node3   Ready    master   5h46m   v1.18.3
Now if you reboot node1, the master IP is automatically taken over by another node. Therefore kubectl commands still work while node1 is being rebooted. As an excercise, find which failover node has the master IP.
Batteries
Now that we have a kubernetes cluster running with 3 masters and a Highly available endpoint for the API server we can continue to setup the services. From now on you can interact with the Kubernetes cluster from your local machine.
Namespace: sys
kubectl create namespace sys
Metal LB
helm repo add stable https://kubernetes-charts.storage.googleapis.com/
helm repo update

cat > metallb-config.yaml <<EOF
apiVersion: v1
kind: ConfigMap
metadata:
  namespace: sys
  name: metallb-config
data:
  config: |
    address-pools:
    - name: default
      protocol: layer2
      addresses:
      - 10.0.200.0-10.0.255.0
EOF
kubectl apply -f metallb-config.yaml
helm install metallb stable/metallb --namespace sys
See the metallb helm chart for full configuration options.
Nginx-ingress
cat > nginx-ingress-values.yaml <<EOF
controller:
  kind: DaemonSet
  daemonset:
    useHostPort: true
    hostPorts:
      http: 30080
      https: 30443
  service:
    enabled: false
  metrics:
    enabled: true
    service:
      annotations:
        prometheus.io/scrape: "true"
        prometheus.io/port: "10254"

defaultBackend:
  image:
    repository: cinaq/default-backend
    tag: 1.2
  replicaCount: 2
EOF
helm install nginx-ingress stable/nginx-ingress --namespace sys -f nginx-ingress-values.yaml
See the nginx-ingress helm chart for full configuration options.
Cert-manager (Letsencrypt)
helm repo add jetstack https://charts.jetstack.io
helm repo update

# updated on 2020-08-12 ref: https://github.com/jetstack/cert-manager/issues/2752
helm install cert-manager jetstack/cert-manager --namespace sys --version v0.16.1 --set installCRDs=true

cat > issuer_letsencrypt.yaml <<EOF
apiVersion: cert-manager.io/v1alpha2
kind: ClusterIssuer
metadata:
  name: letsencrypt
  namespace: sys
spec:
  acme:
    # The ACME server URL
    server: https://acme-v02.api.letsencrypt.org/directory
    # Email address used for ACME registration
    email: letsencrypt@example.dev
    # Name of a secret used to store the ACME account private key
    privateKeySecretRef:
      name: letsencrypt
    # Enable the HTTP-01 challenge provider
    solvers:
    - http01:
        ingress:
          class:  nginx
EOF
kubectl create -f issuer_letsencrypt.yaml
See the cert-manager helm chart for full configuration options.
NFS client provisioner
helm install nfs-storage stable/nfs-client-provisioner --namespace sys --set nfs.server=10.0.0.2 --set nfs.path=/volume1/kubernetes
kubectl patch storageclass nfs-client -p '{"metadata": {"annotations":{"storageclass.kubernetes.io/is-default-class":"true"}}
See the nfs-server-provisioner helm chart for full configuration options.
Namespace: monitoring
kubectl create namespace monitoring
Prometheus
cat > prometheus-values.yaml <<EOF
alertmanager:
  replicaCount: 2
pushgateway:
  replicaCount: 2
server:
  replicaCount: 2
  statefulSet:
    enabled: true
EOF
helm install prometheus stable/prometheus -n monitoring -f prometheus-values.yaml
See the prometheus helm chart for full configuration options.
Loki
helm repo add loki https://grafana.github.io/loki/charts
helm repo update

helm install loki loki/loki-stack -n monitoring
See the loki-stack helm chart for full configuration options.
Grafana
cat > grafana-values.yaml <<EOF
persistence:
  enabled: true
replicas: 2
EOF
helm install grafana stable/grafana -n monitoring -f grafana-values.yaml
After the helm install, save the grafana password for later.
See the grafana helm chart for full configuration options.
Expose grafana via Ingress:
cat > grafana-resources.yaml <<EOF
apiVersion: extensions/v1beta1
kind: Ingress
metadata:
  name: grafana-ingress
  namespace: monitoring
  annotations:
    cert-manager.io/cluster-issuer: "letsencrypt"
    nginx.ingress.kubernetes.io/proxy-body-size: 1m
    nginx.ingress.kubernetes.io/server-snippet: |
      # IP white-listing
      allow 192.168.1.0/24;
      allow YOUR_PUBLIC_IP;
      deny all;
spec:
  tls:
  - hosts:
    - grafana.sys.example.dev
    secretName: dev-grafana-sys-grafana-tls
  rules:
  - host: grafana.sys.example.dev
    http:
      paths:
      - path: /
        backend:
          serviceName: grafana
          servicePort: 80
EOF
Now you should be able to visit grafana via the public URL: http://grafana.sys.example.dev and notice you get redirected automatically to HTTPS and it’s signed by LetsEncrypt.
Login here with the password from grafana installation with username admin.
After login configure the 2 datasources:
- loki: http://loki:3100
- prometheus: http://prometheus-server
Then import the dashboards:
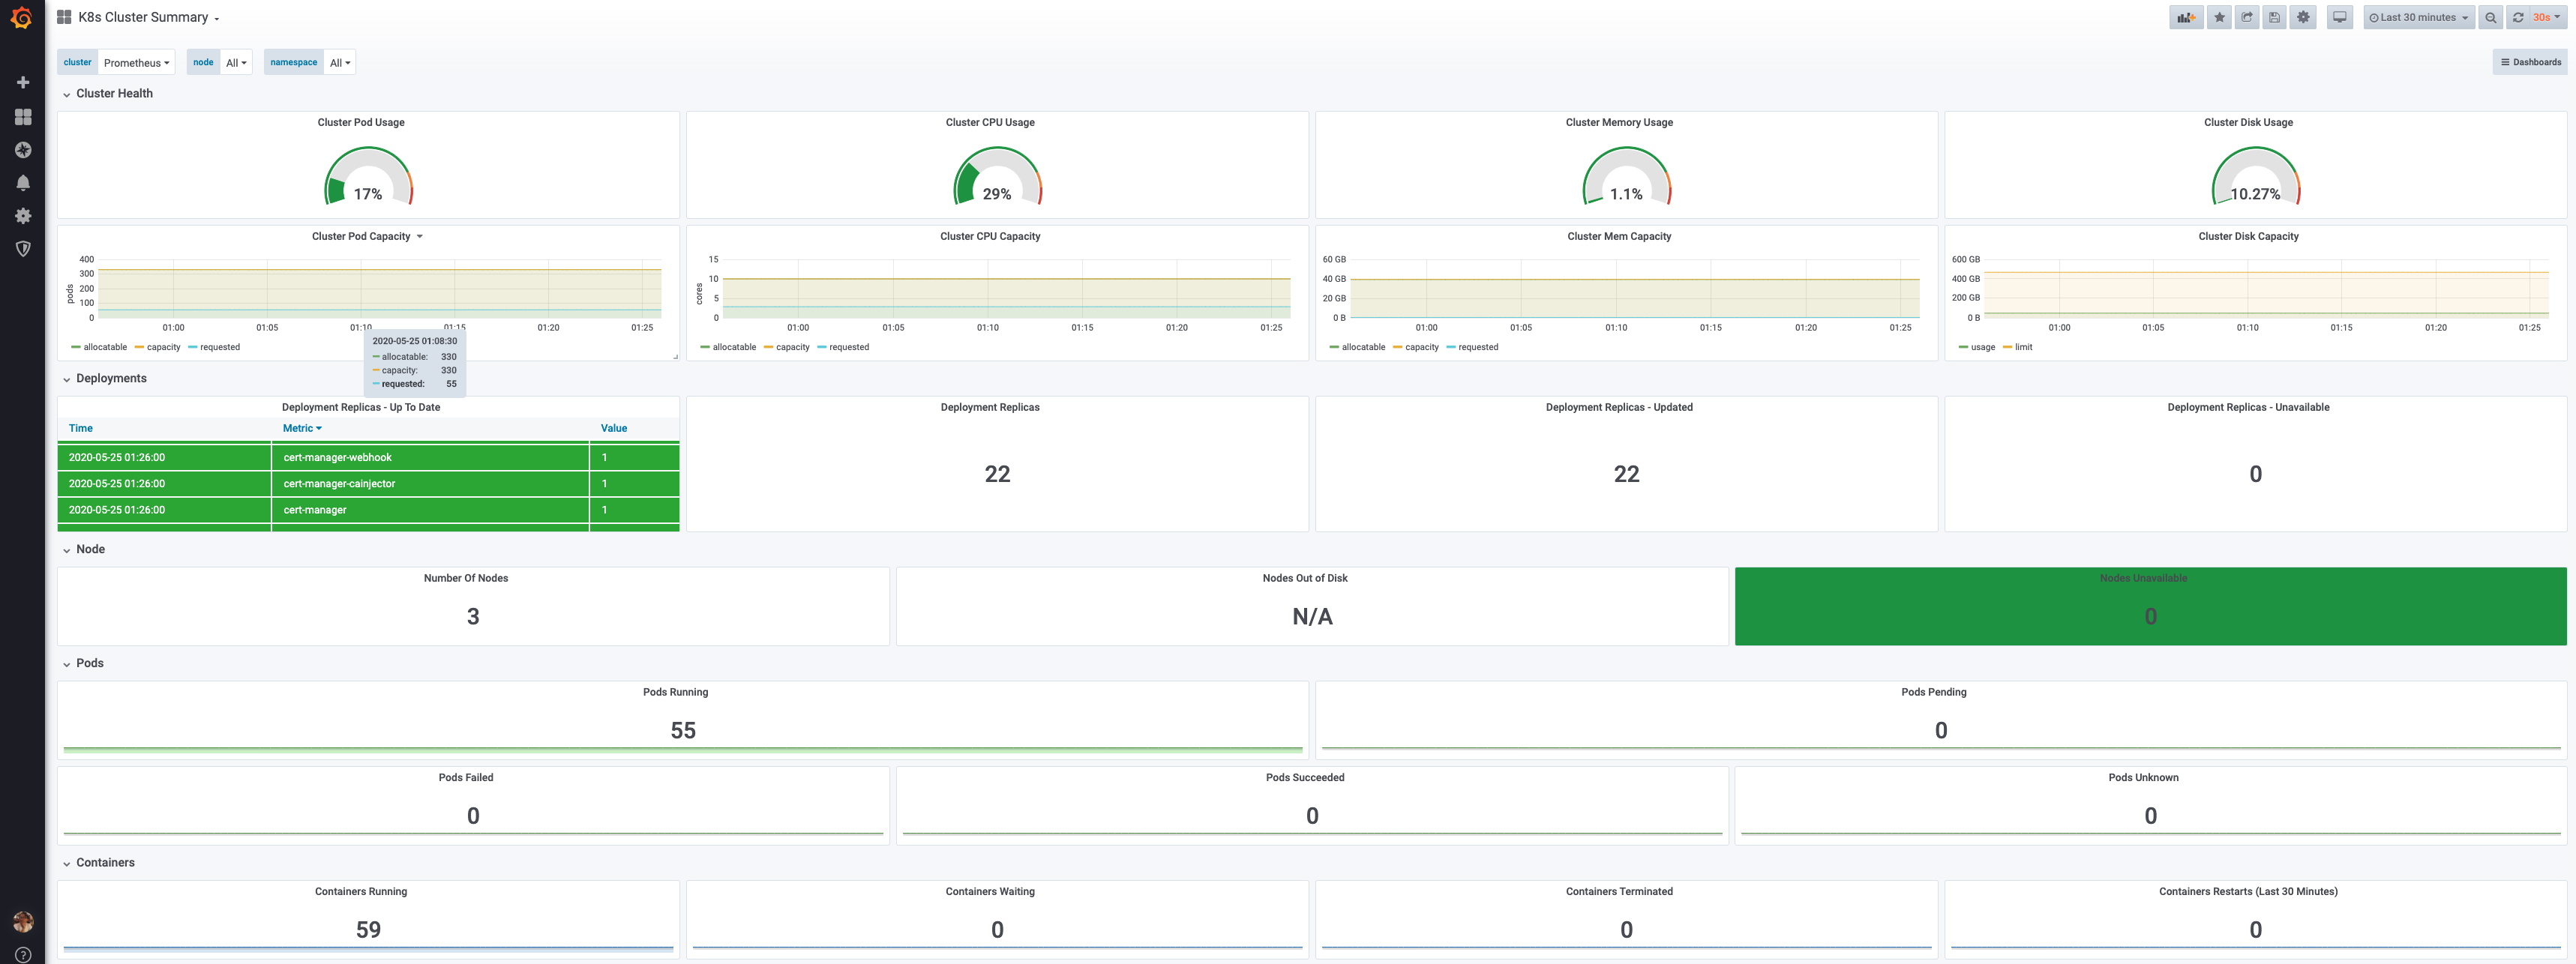
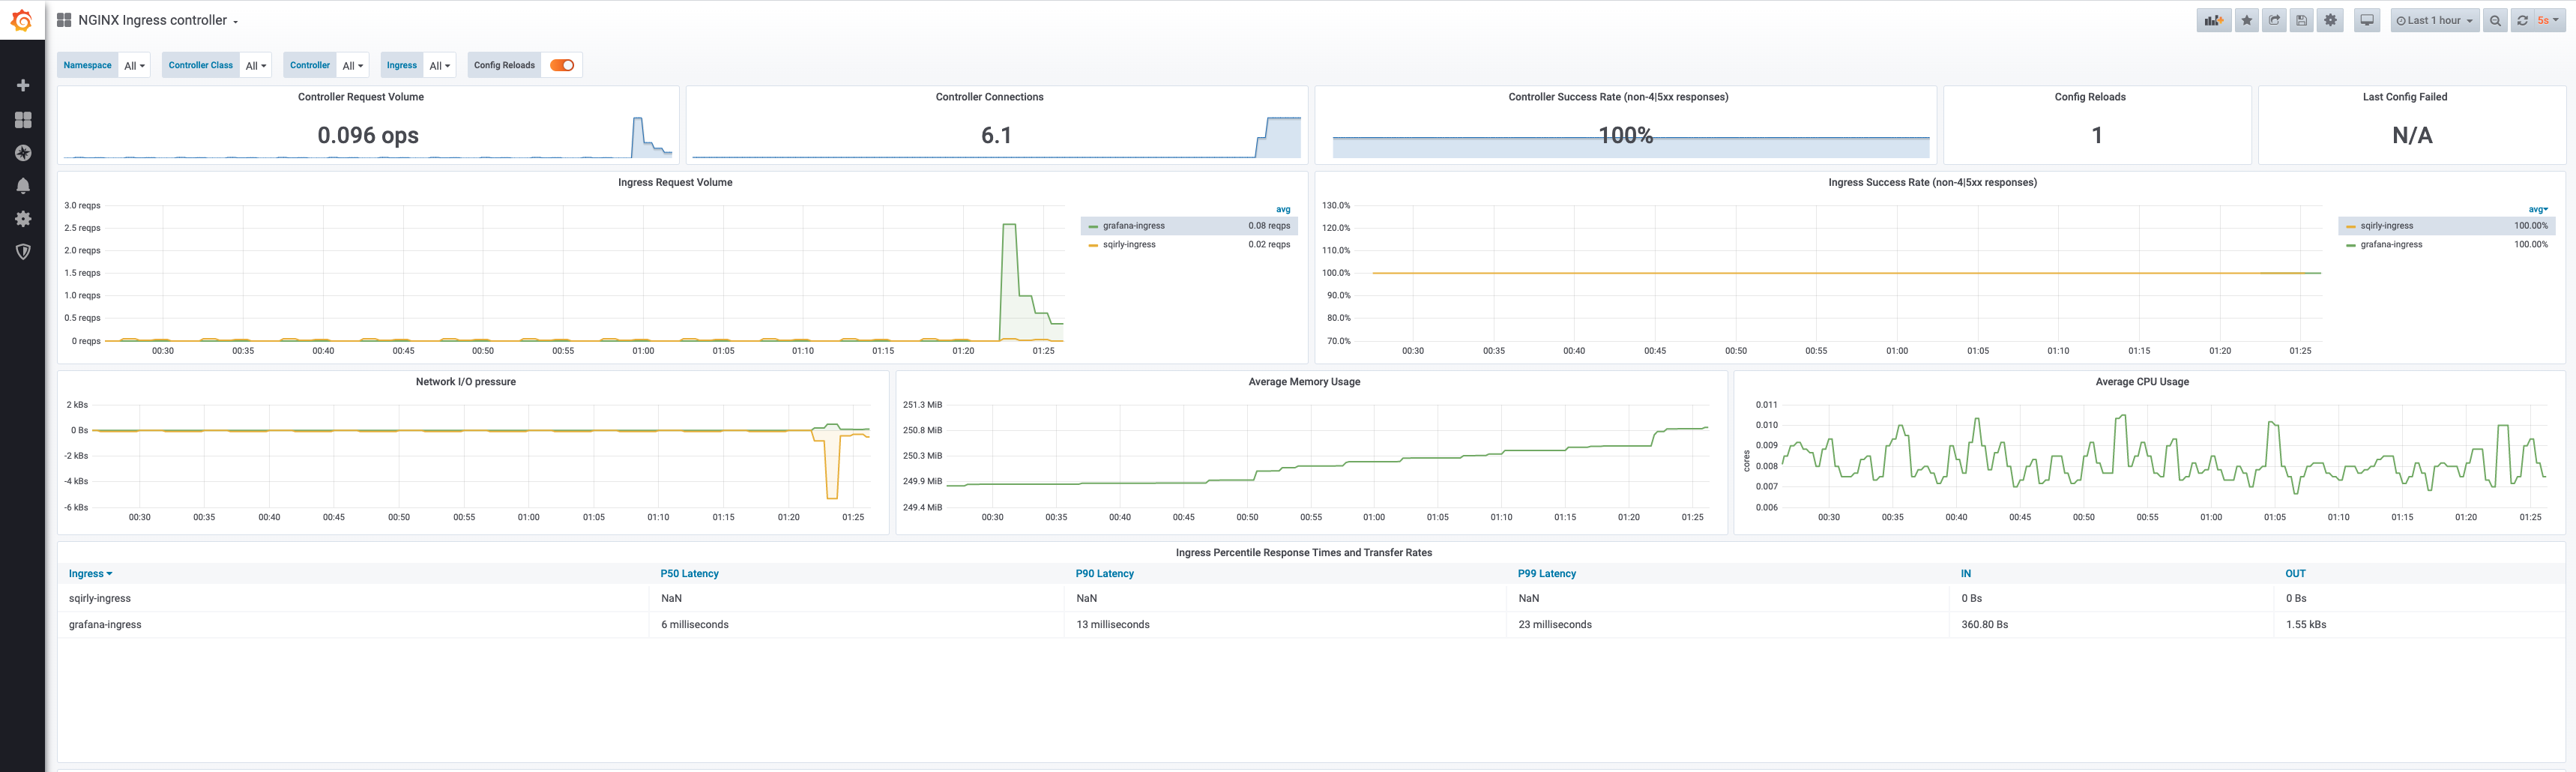
Results
Your deployment is now complete. It should look like:
$ kubectl get pods -A -o wide
NAMESPACE     NAME                                                 READY   STATUS    RESTARTS   AGE     IP                NODE    NOMINATED NODE   READINESS GATES
kube-system   calico-kube-controllers-789f6df884-g2gm4             1/1     Running   2          3d2h    192.168.166.149   node1   <none>           <none>
kube-system   calico-node-8nv5r                                    1/1     Running   1          6h27m   10.0.1.3          node3   <none>           <none>
kube-system   calico-node-srxdd                                    1/1     Running   3          3d2h    10.0.1.1          node1   <none>           <none>
kube-system   calico-node-tslz8                                    1/1     Running   6          3d2h    10.0.1.2          node2   <none>           <none>
kube-system   coredns-66bff467f8-6dsk5                             1/1     Running   1          5h24m   192.168.135.30    node3   <none>           <none>
kube-system   coredns-66bff467f8-z2b9h                             1/1     Running   2          3d2h    192.168.166.148   node1   <none>           <none>
kube-system   etcd-node1                                           1/1     Running   3          3d2h    10.0.1.1          node1   <none>           <none>
kube-system   etcd-node2                                           1/1     Running   7          3d2h    10.0.1.2          node2   <none>           <none>
kube-system   etcd-node3                                           1/1     Running   1          6h27m   10.0.1.3          node3   <none>           <none>
kube-system   kube-apiserver-node1                                 1/1     Running   8          3d2h    10.0.1.1          node1   <none>           <none>
kube-system   kube-apiserver-node2                                 1/1     Running   9          3d2h    10.0.1.2          node2   <none>           <none>
kube-system   kube-apiserver-node3                                 1/1     Running   1          6h27m   10.0.1.3          node3   <none>           <none>
kube-system   kube-controller-manager-node1                        1/1     Running   35         3d2h    10.0.1.1          node1   <none>           <none>
kube-system   kube-controller-manager-node2                        1/1     Running   35         3d2h    10.0.1.2          node2   <none>           <none>
kube-system   kube-controller-manager-node3                        1/1     Running   4          6h27m   10.0.1.3          node3   <none>           <none>
kube-system   kube-proxy-cj42b                                     1/1     Running   5          3d2h    10.0.1.2          node2   <none>           <none>
kube-system   kube-proxy-nt7zn                                     1/1     Running   2          3d2h    10.0.1.1          node1   <none>           <none>
kube-system   kube-proxy-s8vgt                                     1/1     Running   1          6h27m   10.0.1.3          node3   <none>           <none>
kube-system   kube-scheduler-node1                                 1/1     Running   30         3d2h    10.0.1.1          node1   <none>           <none>
kube-system   kube-scheduler-node2                                 1/1     Running   33         3d2h    10.0.1.2          node2   <none>           <none>
kube-system   kube-scheduler-node3                                 1/1     Running   5          6h27m   10.0.1.3          node3   <none>           <none>
monitoring    grafana-74f7c48746-9dvxf                             1/1     Running   0          3h31m   192.168.104.53    node2   <none>           <none>
monitoring    grafana-74f7c48746-txwrv                             1/1     Running   0          3h30m   192.168.135.43    node3   <none>           <none>
monitoring    loki-0                                               1/1     Running   0          4h39m   192.168.104.47    node2   <none>           <none>
monitoring    loki-promtail-785qg                                  1/1     Running   4          3d1h    192.168.104.3     node2   <none>           <none>
monitoring    loki-promtail-8fnkw                                  1/1     Running   1          3d1h    192.168.166.151   node1   <none>           <none>
monitoring    loki-promtail-8vwpf                                  1/1     Running   1          6h27m   192.168.135.37    node3   <none>           <none>
monitoring    prometheus-alertmanager-6fcfd7bb84-mvm9k             2/2     Running   2          5h11m   192.168.135.33    node3   <none>           <none>
monitoring    prometheus-alertmanager-6fcfd7bb84-ndbhd             2/2     Running   0          3h27m   192.168.104.61    node2   <none>           <none>
monitoring    prometheus-kube-state-metrics-79f5b77cb8-4kh9x       1/1     Running   1          5h24m   192.168.135.27    node3   <none>           <none>
monitoring    prometheus-node-exporter-278sb                       1/1     Running   1          6h22m   10.0.1.3          node3   <none>           <none>
monitoring    prometheus-node-exporter-czrbw                       1/1     Running   4          3d      10.0.1.2          node2   <none>           <none>
monitoring    prometheus-node-exporter-xfw7s                       1/1     Running   1          3d      10.0.1.1          node1   <none>           <none>
monitoring    prometheus-pushgateway-5d85697467-88mp5              1/1     Running   0          3h27m   192.168.104.23    node2   <none>           <none>
monitoring    prometheus-pushgateway-5d85697467-hff9t              1/1     Running   1          5h24m   192.168.135.38    node3   <none>           <none>
monitoring    prometheus-server-0                                  2/2     Running   0          3h21m   192.168.104.19    node2   <none>           <none>
monitoring    prometheus-server-1                                  2/2     Running   0          3h20m   192.168.135.44    node3   <none>           <none>
sqirly        postgresql-545d95dcb9-npnbj                          1/1     Running   0          5h12m   192.168.166.153   node1   <none>           <none>
sqirly        sqirly-5d674b8d5b-ktbsw                              1/1     Running   1          6h16m   192.168.135.41    node3   <none>           <none>
sqirly        sqirly-5d674b8d5b-mnzzv                              1/1     Running   5          5h24m   192.168.166.152   node1   <none>           <none>
sys           cert-manager-678bc78d5d-gmb86                        1/1     Running   1          5h24m   192.168.135.26    node3   <none>           <none>
sys           cert-manager-cainjector-77bc84779-bq9xx              1/1     Running   4          5h24m   192.168.135.36    node3   <none>           <none>
sys           cert-manager-webhook-5b5485577f-5wz6c                1/1     Running   1          5h24m   192.168.135.40    node3   <none>           <none>
sys           distcc-deployment-5d6fb547d7-pjhd7                   1/1     Running   1          5h24m   192.168.135.42    node3   <none>           <none>
sys           metallb-controller-9f46bdfcb-zbtsw                   1/1     Running   1          6h12m   192.168.135.39    node3   <none>           <none>
sys           metallb-speaker-4bpqd                                1/1     Running   1          3d2h    10.0.1.1          node1   <none>           <none>
sys           metallb-speaker-t2jpt                                1/1     Running   4          3d2h    10.0.1.2          node2   <none>           <none>
sys           metallb-speaker-w4q2s                                1/1     Running   1          6h27m   10.0.1.3          node3   <none>           <none>
sys           minio-6df88b9995-x8qpt                               1/1     Running   1          5h12m   192.168.135.31    node3   <none>           <none>
sys           nfs-storage-nfs-client-provisioner-8fcb6b749-nskl4   1/1     Running   1          5h12m   192.168.135.28    node3   <none>           <none>
sys           nginx-ingress-controller-jxhtn                       1/1     Running   0          3h57m   192.168.166.159   node1   <none>           <none>
sys           nginx-ingress-controller-kk6sn                       1/1     Running   0          3h57m   192.168.104.20    node2   <none>           <none>
sys           nginx-ingress-controller-s4ndr                       1/1     Running   1          3h57m   192.168.135.32    node3   <none>           <none>
sys           nginx-ingress-default-backend-5c667c8479-hn769       1/1     Running   1          5h24m   192.168.135.29    node3   <none>           <none>
sys           nginx-ingress-default-backend-5c667c8479-zhnl8       1/1     Running   0          4h53m   192.168.166.154   node1   <none>           <none>
Conclusions
This setup is not truly highly available. The whole cluster depends on the Synology as data storage. You could improve this further by replacing the centralized NAS with a distributed solution. But besides that the cluster is very solid and scalable. Rebooting any of the NUC’s, your application experiences almost zero down time. In case of a node outage, requests active on the broken node will be aborted. Also if the broken node happens to be the active master. But it will failover automatically to another master node.